Case study
US renewable energy, 1965 to 2021
How has US renewable electricity changed over 57 years, and what patterns can machine learning find in it? This project merges 17 public datasets into one view of US solar, wind, hydro, biofuel and geothermal energy, then runs exploration, clustering, association rules, classification and regression on it.
- Years of data
- 57
- Datasets merged
- 17
- K-Means silhouette, k=2
- 0.881
- Solar growth, 2010 to 2021
- 55x
What the data shows
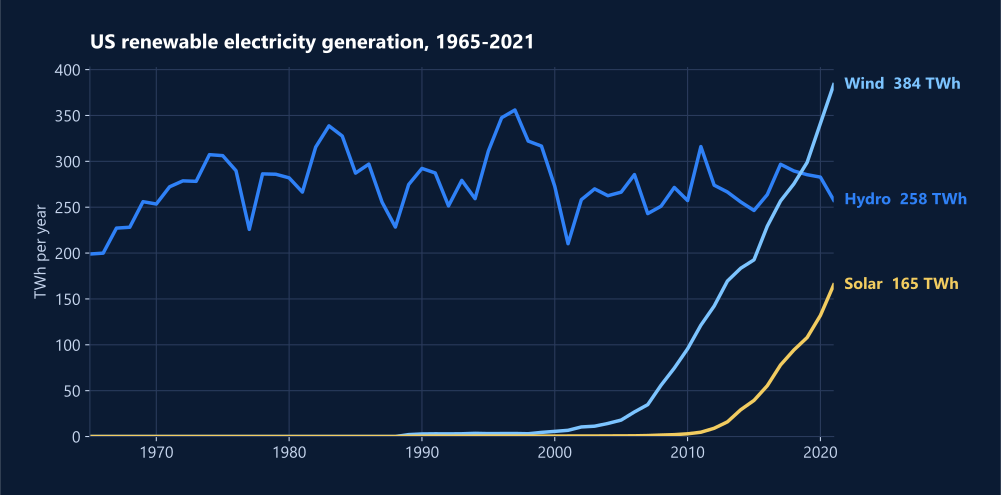
- Wind passed hydro in 2019, at 298.9 TWh against 285.5 TWh, and reached 383.6 TWh by 2021.
- Solar grew 55x in eleven years, from 3.0 TWh in 2010 to 165.4 TWh in 2021.
- Solar and wind rose together, while hydro and geothermal stayed broadly stable.
- K-Means finds the cleanest split at k = 2 (silhouette 0.881): the hydro-dominated decades, and the wind and solar build-out.
Approach
- Merged 17 CSV files, isolated the US, and checked gaps and duplicates; then plotted trends, scatter plots, stacked areas and correlations.
- Looked for structure with K-Means and silhouette analysis, hierarchical clustering with cosine distance, and Apriori association rules (the last two in R).
- Ran decision-tree regression and Naive Bayes on binned generation for solar, wind and hydro.
- Fit SVM regression with linear, RBF and polynomial kernels, and extrapolated it to 2034.
- Pulled annual totals from the US Energy Information Administration API.
Limitations
- The 2034 extrapolation is a modeling exercise, not a projection: it starts below the latest actuals, with 50.8 TWh of solar for 2024 against 165.4 TWh generated in 2021.
- Some tests are tiny. The Naive Bayes test set has only 12 years, so its accuracies (0.33 to 0.75) swing widely.