Case study
Cancer patient survival analysis
How long do patients live after a cancer diagnosis, and how much of that can routine clinical data explain? This team project follows 988 patients, compares survival across tumor stages, and tests whether machine learning can predict each patient's survival time.
- Patients
- 988
- Clinical fields
- 13
- Best MAE, SVR
- 31.2 months
- Best R-squared
- -0.07
Data
The dataset has 988 patients and 13 clinical fields: age at diagnosis, vital status, tumor stage and grade, residual disease, primary therapy outcome, cancer status, overall and progression-free survival, and platinum-free interval and status. Patient IDs follow The Cancer Genome Atlas (TCGA) barcode format.
Approach
- Cleaned the data: median imputation for numbers, mode for categories, encoding, standardization, and an 80/20 train and test split.
- Explored distributions, category breakdowns and correlations.
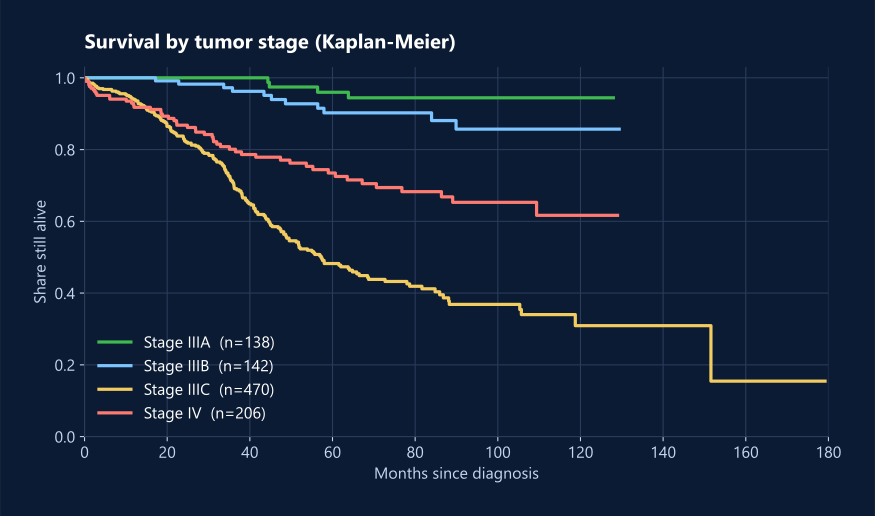
- Estimated Kaplan-Meier survival curves by patient group with lifelines.
- Trained Random Forest, Gradient Boosting, SVR and XGBoost regressors on overall survival, scored by MAE, RMSE and R-squared.
Stage separates outcomes
Survival time resists prediction
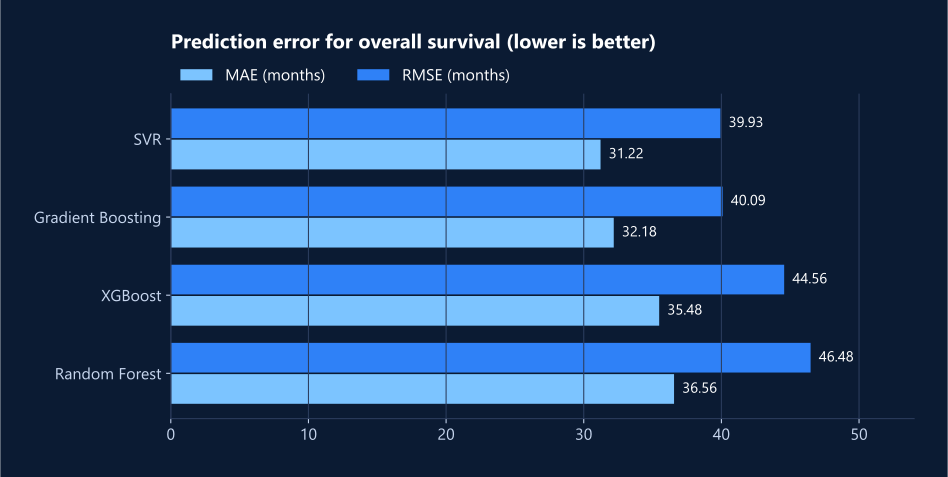
| Model | MAE (months) | RMSE (months) | R-squared |
|---|---|---|---|
| SVR | 31.22 | 39.93 | -0.07 |
| Gradient Boosting | 32.18 | 40.09 | -0.08 |
| XGBoost | 35.48 | 44.56 | -0.34 |
| Random Forest | 36.56 | 46.48 | -0.45 |
Every model scores a negative R-squared on held-out patients, so none beats predicting the average survival time. Clinical fields alone don't carry enough signal; molecular or genomic data would likely be needed.